The LeCoach Plan Health Score
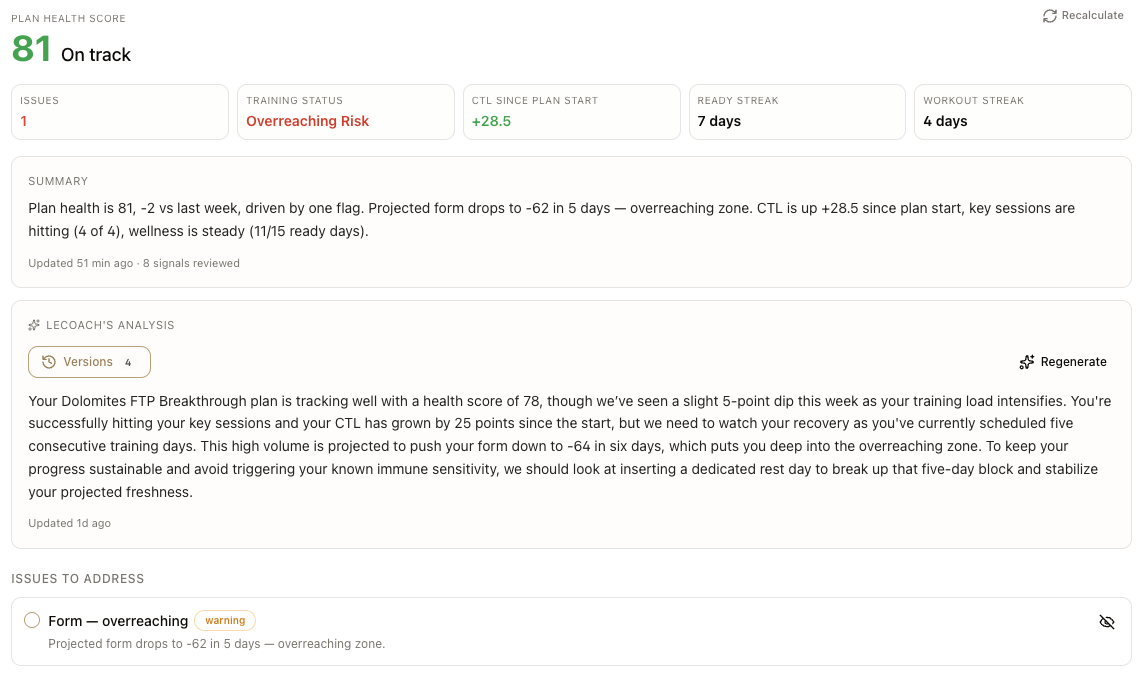
A fully custom training plan, paired with transparent signals that only flag meaningful deviation — under-training, overtraining, or wrong training like zone drift. You see what changed, you understand why it matters, and you decide what to do next with your AI coach right next to you.
A third path between static and closed-adaptive
You start the block fresh, motivated and on schedule. Five weeks in, you have moved a workout, missed two, added an unplanned race, slept badly for a week and skipped a long ride. The plan is still sitting there in your calendar like nothing happened — but the question every serious cyclist actually wants answered is: is this plan still working for me, today, given everything that has happened?
Today you basically have two options. Static plans — PDFs, spreadsheets, generic templates — that sit in your calendar and never react, no matter what happens to you. Or closed adaptive systems like Join or TrainerRoad Adaptive Training that quietly rewrite your plan behind the scenes, often over-triggering on tiny deviations like one missed workout, and leaving you unsure what changed or why. Neither actually helps you understand your own training.
LeCoach is built around a different idea. We generate a fully custom training plan tailored to you, and then surface a small set of transparent signals that only flag deviation when it is genuinely significant and disruptive — whether that is under-training, overtraining, or wrong training like zone-balance drift. The Plan Health page shows those signals, educates you on what each one means, and then puts the decision in your hands, with the AI coach right there to discuss it. That last part — informed decisions, made together — is the entire point.
Show. Educate. Decide together.
Not a silent algorithm rewriting your plan, and not a static PDF that ignores reality. A plan that adapts because you adapt it — with full visibility and an AI coach next to you.
Show
Educate
Decide together
What is the Plan Health Score?
A 0–100 score, colour-coded green / amber / red, that grades the overall health of your active training plan right now. It updates automatically as your plan progresses and recalculates instantly when you ask it to. It is the headline of the plan health page, and underneath it sits everything that went into the score: five live stats, a deterministic summary, an AI analysis, and a list of active signals you can act on.
The point is not to give you "a number" — it is to give you a single, honest read on your plan that you can trust at a glance, plus the transparency to drill into exactly why the score is what it is.
The three questions every adaptive training plan has to answer
Every card on the plan health page falls into one of three buckets. That is the design.
Is the plan working?
Are you executing it?
Is the plan well-built?
1. Is the plan working?
Plan goal, fitness growth, and form.
Plan goal
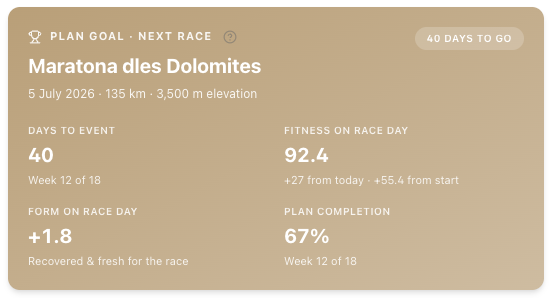
Restates what the plan is aiming at — an A-event for race plans, the next race on your calendar, or "general fitness" for open-ended plans — and shows the four numbers that actually matter: days to event, projected fitness on race day in CTL terms, projected form on race day in TSB terms, and plan completion percent. The form number is the one most cyclists never see properly. A projected TSB of +10 to +20 means you will roll up to the start line recovered and fast; a projected −15 means you are still buried in fatigue. We surface it weeks out, while you can still fix it. See also periodization for cyclists.
Fitness growth
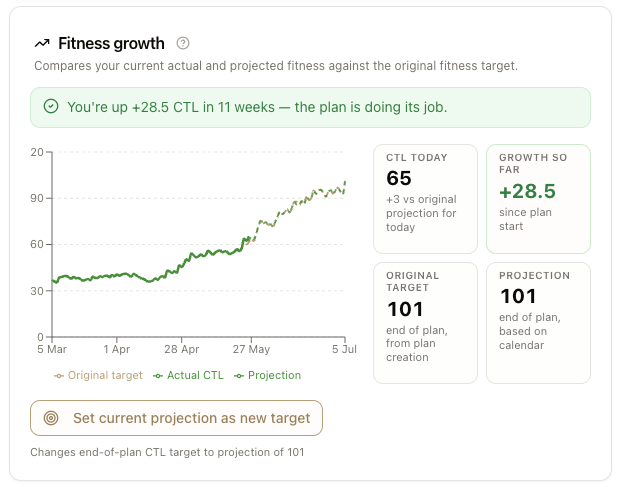
Three lines on the same axes: the CTL projection LeCoach built when you created the plan, your actual CTL day by day, and a fresh projection based on what is still scheduled. More honest than the typical "fitness trend" chart, which shows only the past. This shows the past plus what the plan still has in store for you, plus what was promised at the start. If the projection is drifting below the original target, you are heading into the event under-built — and the verdict bar above the chart will tell you so in one sentence. Pairs naturally with progressive overload.
Form & load
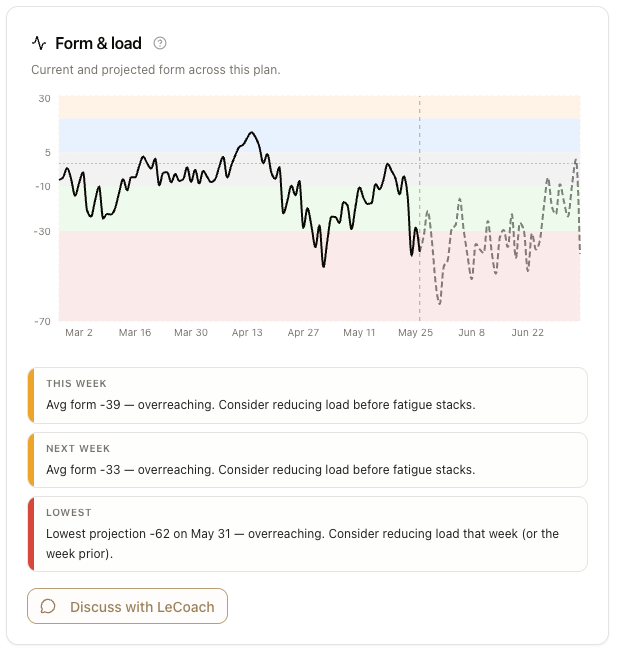
Checks whether this week's average form (TSB) matches what the block type of your plan calls for. Base, build and peak weeks expect slightly negative form (you are meant to be loaded). Deload, recovery and taper weeks expect positive form (you are meant to be fresh). The card flags you if you are too fresh in a loading week (under-training the block) or too fatigued in a recovery week (defeating the purpose). This block-awareness is the part most other dashboards miss — a TSB of +5 is not "good" or "bad" in isolation, it is good or bad relative to what week you are in.
2. Are you executing the plan?
This week, workout quality, and wellness.
This week — time and load
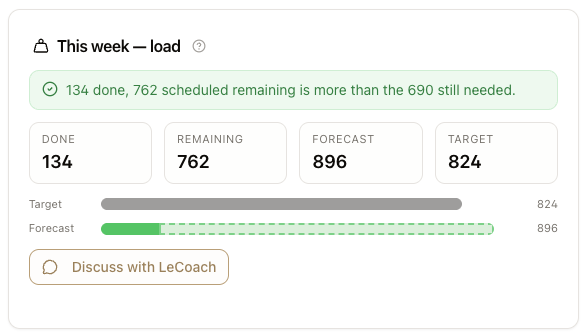
Shows how many hours you have trained this week, how much is still scheduled, the resulting end-of-week forecast, and the weekly target — and tells you in one sentence whether the forecast hits target. Sick days, holidays, and days you have marked as injured or blocked reduce the target proportionally, so a "missed" six-hour week does not get flagged as a failure when you were actually on a work trip with two blocked days. The load card is the same view but in training stress (TSS) instead of hours.
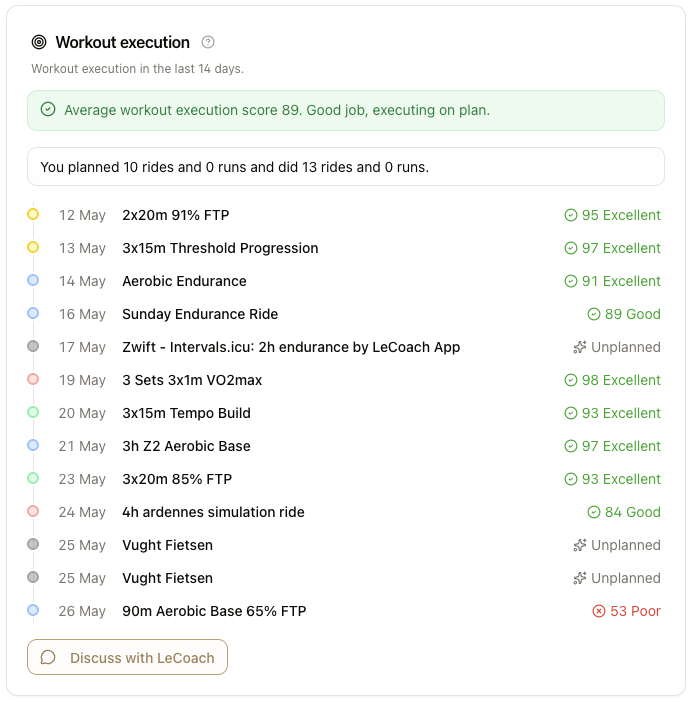
Workout execution
Looks at every ride and run from the last 14 days and grades how you executed each one. Workouts are bucketed as good, fair, poor, missed (scheduled but not done) or unplanned (you rode but it was not on the plan), with an average execution score across the window. The score is multi-dimensional — it compares planned vs actual on zone match, duration, intensity and load — so a 90-minute Z2 ride that turned into a 60-minute Z3 group ride does not slip through as "done". Closely related: cycling training zones and training with a power meter.
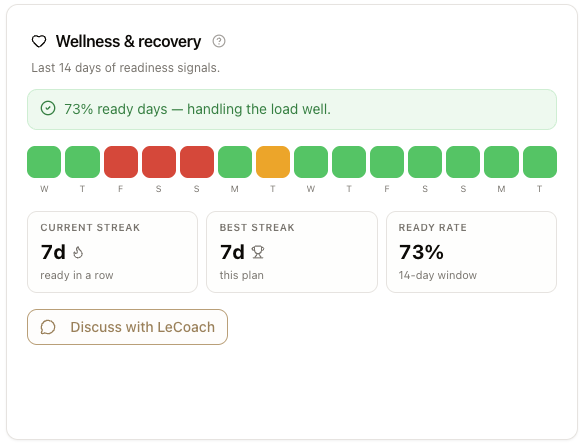
Wellness & recovery
Your last 14 days of readiness tiers as colored chips (ready / possible impact / attention needed), your current consecutive ready streak, your longest ready streak in this plan, and the percent of ready days in the window. This is the early-warning system: if your wellness has been suppressed for multiple days in a row, the plan can be perfect on paper and still be wrong for you, and the card will flag it. Deep dive: HRV for cyclists and cycling recovery.
3. Is the plan well-built?
Zone balance, long rides, and overtraining guardrails.
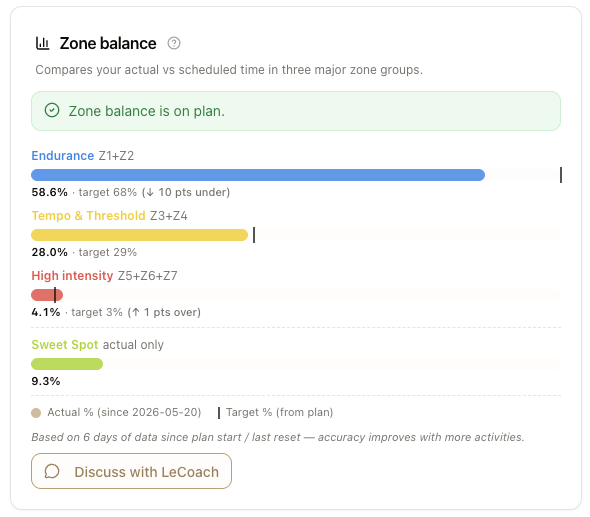
Zone balance
How your training time so far in this plan is actually distributed across three zone groups — Endurance (Z1–Z2), Tempo & Threshold (Z3–Z4) and High intensity (Z5–Z7) — compared against what the plan scheduled, in percentage-point terms, from plan start. Sweet Spot is shown as actual only because it is not a separate target. The polarized vs pyramidal vs threshold conversation, made concrete and specific to your plan. If your "polarized" plan has quietly drifted into 25% threshold work, you will see it here.
Long-ride floor
Tracks the longest single ride each week against an absolute minimum — by default the larger of 25% of your weekly hours target or 90 minutes, and editable per athlete. The bar chart shows past weeks plus the longest planned ride upcoming, with a dashed floor line. The long ride is the most commonly cut, most commonly forgotten and most commonly under-prescribed workout in cycling training plans — and the one that disproportionately drives endurance adaptation. This card makes it impossible to drop without noticing.
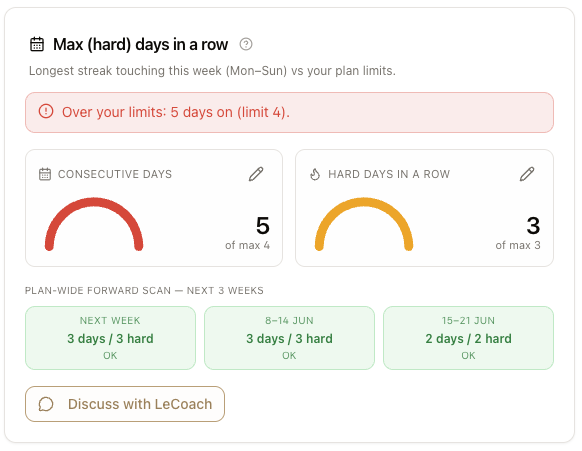
Max consecutive and hard days
Two overtraining guardrails: maximum consecutive training days, and maximum consecutive hard days (Z4 and above) in a row. The number shown is the longest streak that touches this Mon–Sun week — counted across week boundaries, not reset on Mondays the way most calendar views do. A forward scan warns you if any upcoming week is set to break either limit, so you can fix it before you ride into it. Both limits are user-editable from the card.
Why no other cycling platform works this way
TrainerRoad Adaptive Training
Join
Static plans (PDFs, templates, spreadsheets)
Intervals.icu and generic "AI coach" wrappers
LeCoach is not trying to be a better closed adaptive system. It is a different category. We generate the plan, ingest the activities, score the wellness, run the AI coach and render the dashboard end-to-end, on one data model — but the goal of all that machinery is not to take decisions away from you. It is to surface only the signals that actually matter, explain them in plain language, and hand the call back to you and your AI coach.
That is why every signal is visible, every threshold is documented, and every alert has a Discuss with LeCoach button that opens a coaching conversation with the full context attached. Closed systems are black boxes. Static plans are blind. LeCoach is a glass box with a coach sitting next to it — which is what an AI cycling coach should actually feel like, and how it compares to a human coach.
How to use the plan health page
Weekly check-in
Mid-week health check
Pre-event readiness pass
Used this way, the plan health page stops being a dashboard you check and starts being the closest thing solo cyclists have ever had to a real, embedded coach quietly auditing the plan in the background, every day, and tapping you on the shoulder when it is time to change something.
A custom plan, transparent signals, you in the loop
Not a static plan that ignores you. Not a closed system that adapts behind your back. A fully custom plan, transparent signals that flag only meaningful deviation, and an AI coach next to you when it is time to decide what to do.