On the morning of May 15, 2026, a real LeCoach user woke up, checked their data, and got two completely opposite answers.
Garmin Training Readiness: 85 / 100 — "High." Sleep score good, HRV status balanced, acute load optimal, recent stress low. Garmin's verdict: you have new energy from a good night's rest. Your body is ready for action.
LeCoach Recovery Score: 56 / 100 — Attention Needed. HRV significantly below normal range. Resting HR slightly elevated above normal. Rest or very light activity is recommended.
Same athlete. Same morning. The same overnight HRV, resting HR, and sleep readings feeding both systems. Completely opposite verdict.
This is not a coincidence or a bug. It is a fundamental difference in methodology — and it has real consequences for how you train, recover, and avoid digging yourself into a hole.
What makes this case study unusually clean is that we have four consecutive days of real data from the same user on both platforms — covering the initial warning, the days the user's body was clearly under stress, the first signs of improvement, and the full rebound. The two systems disagree on almost every day of that arc, and the way they disagree maps directly onto how each one is built. (For background on why HRV behaves the way it does for trained cyclists, see our pillar guide to HRV for cyclists, and for the broader recovery picture our cycling recovery and fatigue hub.)
In this post we'll walk through what Garmin Training Readiness actually measures, why it missed this athlete's warning signs, how LeCoach's Recovery Score is built differently, and what peer-reviewed exercise physiology says about which approach is more useful in real life.
What is Garmin Training Readiness?
Garmin Training Readiness is a daily 0–100 score, developed in partnership with Firstbeat Analytics, that tells you how prepared your body is for a hard training session. It is one of the most-used "should I train hard today?" features in cycling, running, and triathlon, and it appears on every modern Garmin endurance watch — Fenix, Epix, Forerunner 9xx/7xx, Edge cycling computers, and the rest.
The score draws on six contributing factors:
Sleep score — Quality and duration of last night's sleep.
Recovery time — Garmin's estimate of how many hours of rest you still need based on recent training load.
HRV status — A summary of your overnight heart rate variability, evaluated against your personal baseline.
Acute load — Training stress accumulated over the last 7 days.
Recent sleep history — How your sleep has trended over the past 3 nights.
Recent stress — Daytime stress estimated from HRV.
On paper, this is a reasonable list of wellness signals. In practice — and as the case study below shows — there are structural problems with how Garmin Training Readiness weights and combines them.
The case study: Garmin Training Readiness 85 vs LeCoach 56
Here is the actual data from the same user on the same morning, pulled from both apps side by side.
Garmin Training Readiness — 85 / 100 "High"
The Garmin screen reports:
Sleep score: 89 — Good
Recovery time: 14h remaining — "Low need"
HRV status: 68 ms (7-day average) — "Balanced"
Acute load: 531 — Optimal
Recent sleep scores: Excellent
Recent stress: Low
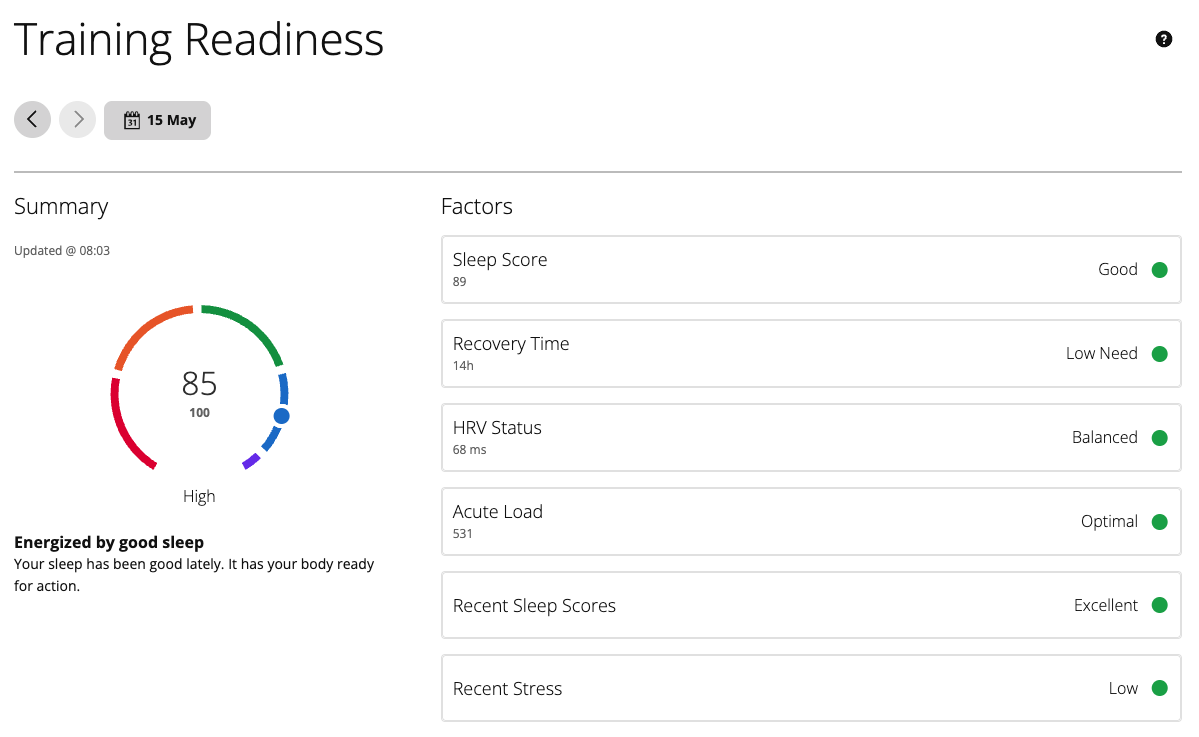
Garmin's verdict: "New energy from a good night's rest. Your body is ready for action."
LeCoach Recovery Score — 56 / 100 "Attention Needed"
The LeCoach screen, on the same morning, with the same overnight data, reports:
HRV: 58 ms — Lowered. 7-day median 70 ms, 28-day median 67 ms.
Rest HR: 48 bpm — Slightly elevated. 7-day median 45 bpm, 28-day median 47 bpm.
Sleep: 8h 3m — Good. 7-day median 8h 14m.
Sleep Score: 89 — Good. 7-day median 87.
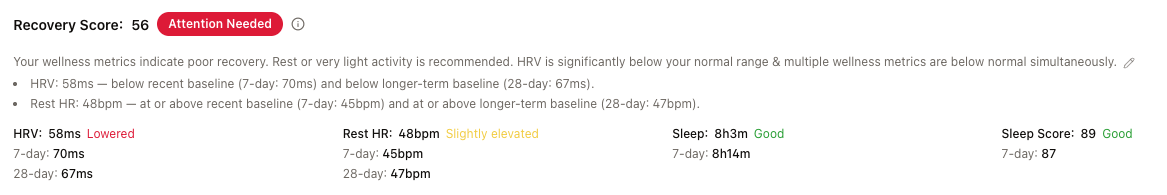
LeCoach's verdict: "Your wellness metrics indicate poor recovery. Rest or very light activity is recommended. HRV is significantly below your normal range, and multiple wellness metrics are below normal simultaneously."
Why Garmin Training Readiness scored this athlete as "Ready"
Problem 1: The HRV signal is averaged, not shocked
This is the most consequential issue.
Garmin's HRV Status is, by design, a smoothed metric. According to Garmin's own documentation, HRV Status uses a 7-day rolling average of overnight HRV, compared to a baseline range built from approximately the last 90 days, weighted toward more recent data (Garmin: Understanding HRV Status). The score contribution from HRV Status is driven by where that 7-day average sits inside the baseline range.
For this athlete, the 7-day HRV average is 68 ms — comfortably in the green zone. Their HRV has been tracking steadily in the mid-60s to low 70s all week. So Garmin's HRV Status reads: balanced.
But look closely at the Garmin HRV chart. The dashed line is the overnight average for the most recent night. It plummets to 58 ms — more than 10 ms below this athlete's own recent baseline. That's a ~15% single-day drop. And because the 7-day average still contains four prior days of 66–68 ms readings, the average barely moves. The signal is diluted by design.
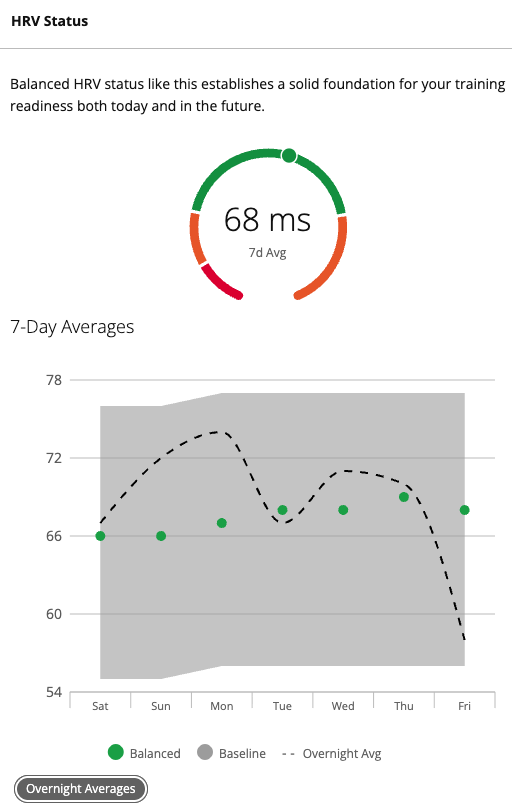
The issue: Garmin Training Readiness is showing you the trend. LeCoach is showing you the shock.
This matters more than it sounds. In exercise physiology, an acute HRV drop is one of the strongest short-term indicators of systemic stress — whether from illness, travel, poor sleep quality, or overreaching. The literature is clear on this point:
Plews, Laursen, Stanley, Buchheit & Kilding (2013) showed that day-to-day HRV deviations from a rolling baseline are more sensitive to physiological state changes than absolute values or simple averages (Sports Medicine).
Buchheit (2014) in a comprehensive Frontiers in Physiology review concluded that individual morning HRV monitoring — tracking deviations from personal baseline — outperforms population norms for detecting acute fatigue and training readiness (Buchheit 2014).
Plews et al. (2012) showed that weekly-averaged HRV trends correlate with performance, and that meaningful change is best detected by combining a personal baseline with a "smallest worthwhile change" trigger — not by reading the average in isolation.
The operative word in all of this is deviation. The signal is the surprise, not the average. A 7-day rolling mean deliberately erases the most important moment in the data: the moment something changed.
This is also where common interpretations of "you should use a 7-day average" get nuanced. The literature does support using rolling averages to identify trends and filter day-to-day measurement noise. But the same literature is explicit that a sustained 20–30% drop, or even a single-day acute crash, against a personal baseline is a meaningful signal in its own right — especially when accompanied by other autonomic markers moving in the same direction (Plews et al. 2013, Sports Medicine; Flatt & Esco 2016, J Sports Sci Med).
The right architecture is to use the rolling baseline as the reference, and the day's deviation from it as the signal. Garmin scores the reference. LeCoach scores the deviation.
Problem 2: Resting heart rate is missing entirely
Resting heart rate is one of the oldest and most reliable markers of recovery status, illness onset, and overtraining in endurance athletes. It has been in coaching literature since the 1970s and remains a primary recommendation in current sports science practice.
Research from the Norwegian School of Sport Sciences and the Australian Institute of Sport has shown that an unexplained elevation of ~5 bpm in morning resting HR often precedes overt illness symptoms by 24–48 hours. A febrile response increases RHR by roughly 8.5 bpm per 1°C of body temperature rise — meaning RHR can flag a sub-clinical infection before you feel sick.
Garmin Training Readiness does not include resting heart rate as a factor. This isn't speculation; it's confirmed in Garmin's own documentation and in third-party reviews comparing Garmin's approach to competing platforms like Whoop and Coros, which do include RHR (the5krunner: Training Readiness; Garmin Wiki: Training Readiness).
For this athlete on this particular morning, the resting HR data tells a clear story:
7-day median: 45 bpm
28-day median: 47 bpm
This morning: 48 bpm
In isolation, 48 bpm is a perfectly fine resting HR — many cyclists would consider it excellent. But for this athlete, who normally sits at 45–47 across both short and long baselines, it's a clear upward deviation. Combined with the HRV drop, it paints a coherent autonomic picture: something physiological is shifting. (We cover when each of these two markers carries more weight in our companion piece, HRV vs resting heart rate for cyclists.)
Garmin's Training Readiness misses this entirely. The information that should make Garmin more confident in lowering the score is simply not in the formula.
Problem 3: Sleep is counted twice. Load is counted twice. HRV is counted once.
Look at the six Garmin Training Readiness factors again:
Sleep score (last night)
Recent sleep scores (last 3 nights)
Recovery time (derived from recent training load)
Acute load (recent training load)
HRV status (7-day average)
Recent stress (daytime HRV-derived stress)
Sleep is in there twice — once as last night, once as recent history. Training load is in there twice — once as estimated recovery time, once as raw acute load.
The result is a readiness number that is structurally more sensitive to sleep quality and recent training load than the apparent equal-weighting suggests, and less sensitive to the acute autonomic signals (HRV today, RHR today) that can detect something going wrong before it becomes obvious.
The athlete in this case study slept well and had appropriate training load. Three of the six factors will lean positive simply because of those two facts. That structural bias is exactly what pushed the Garmin score to 85.
How LeCoach calculates Recovery Score
LeCoach's Recovery Score is built on a different principle:
Measure how surprising today is, relative to your own normal — for each signal independently — and combine the most reliable signals with sensible weighting.
The algorithm uses four inputs, weighted by how informative each one actually is in practice:
HRV — the most important factor. Uses a dual baseline (short-term and longer-term medians) plus a robust z-score, with an explicit HRV-crash override when today's value drops significantly below baseline.
Resting HR — the second most important factor. Also uses a dual baseline plus a robust z-score, with an explicit RHR-spike override when today's value rises significantly above baseline.
Sleep duration — lower weight. Uses a personal baseline combined with an absolute threshold and a short-sleep override.
Sleep score — lower weight. Uses an absolute threshold + baseline approach, with the contribution dampened when sleep is already in the "good" or "excellent" range.
Every metric is configured to do exactly the job it is best at. A few design choices are worth pulling out, because they are what makes the score behave correctly in real-life edge cases — including this athlete's morning.
(Note: to protect against direct copying by competitor apps, the exact percentages, z-score thresholds, and weight values used by LeCoach have been omitted from this article. The principles below describe what the system does, not the precise numbers.)
Dual baseline: short-term AND long-term, worse-of wins
For HRV and resting HR — the two highest-weighted metrics — LeCoach computes z-scores against both a short-term rolling median and a longer-term rolling median. The worse of the two z-scores is used as the operative signal.
This single design choice solves the most well-known failure mode of short-baseline recovery scores: baseline drift. If your last week has been a slow grind, your short-term baseline drifts down with you, and a "today is normal" reading no longer means "you are well." The longer-term baseline preserves the memory of your real, pre-grind normal.
Robust statistics: median + MAD, not mean + standard deviation
The math uses Median Absolute Deviation (MAD) instead of standard deviation, and median instead of mean. This is a textbook robust-statistics choice and matters more than it sounds:
A standard deviation–based z-score is easily distorted by one or two extreme values. A bad night of HRV can inflate the SD, which then makes the next bad night look more normal than it is.
MAD-based z-scores stay stable in the face of outliers. They describe how far today is from the true center of the distribution, in a way that resists gaming by anomalies in the recent window.
A small MAD floor is applied as a percentage of the median, to prevent the score from going nuclear when an athlete's baseline is unusually steady. Without that floor, a single bpm difference for an extremely consistent sleeper could read as a huge z-score.
Override rules: explicit physiological flags
On top of the weighted composite, LeCoach has a small set of explicit override rules borrowed from sports-science practice:
HRV crash — fires when today's HRV is meaningfully below the short-term median, or when the robust z-score crosses a defined cutoff, or when today is meaningfully below the longer-term median.
RHR spike — fires when today's RHR is meaningfully above the short-term median, or when the robust z-score crosses a defined cutoff, or when today is meaningfully above the longer-term median.
Short sleep — fires when total sleep falls below a defined threshold.
Multi-metric dip — fires when two or more metrics are simultaneously sitting below their respective baseline by a meaningful amount.
When any override fires, the system escalates the readiness tier (e.g., from ready to possible_impact, or from possible_impact to attention_needed) and surfaces a specific, named signal in the AI coaching message — for example, "HRV is significantly below your normal range."
Sleep handled honestly: duration and score, with the right weights
Sleep duration and sleep score are both in the model, but at lower weights — not because sleep doesn't matter, but because:
Sleep duration is the more reliable signal that wearables actually measure well. A 2023 multicenter validation study found that "all but one of the consumer sleep-tracking technologies were able to detect total sleep time with comparable accuracy to research-grade actigraphy," but accuracy on sleep stages (which drive most "sleep score" computations) was significantly more variable (Sensors, 2023).
A normal night's sleep doesn't tell you much about whether your immune system is fighting something — your HRV and RHR will tell you that first.
Sleep score gets a "hybrid threshold" treatment in the LeCoach algorithm: if you are in the absolute "good" or "excellent" tier, small negative deviations from your baseline are dampened. The system doesn't punish you for sleeping "only" 8 hours when your week happened to average 8h 30m. For a deeper dive into how sleep interacts with training recovery for cyclists specifically, see our pillar on sleep and recovery for cyclists.
What happened in LeCoach on this athlete's morning, step by step
Let's run the actual data through the actual algorithm.
HRV: 58 ms today
7-day median: 70 ms. → HRV crash override fires.
28-day median: 67 ms. → Negative on both windows.
Resting HR: 48 bpm today
7-day median: 45 bpm. → today is above 7-day baseline.
28-day median: 47 bpm. → today is above 28-day baseline.
The RHR spike override does not quite fire on these absolute moves, but the resulting z-score is clearly negative on both windows. LeCoach surfaces it as "Slightly elevated" and counts it as one of the dipped metrics.
Sleep duration: 8h 3m (483 min)
Well above the "good" absolute threshold. Positive contribution.
Sleep score: 89
"Excellent" tier, slightly above the 7-day median of 87. Positive contribution.
Composite logic:
HRV crash override has fired.
Two metrics (HRV and RHR) are simultaneously below baseline in a meaningful way. Multi-metric dip override fires.
Two override triggers → readiness tier escalates to attention_needed.
Severity multiplier kicks in for HRV, adding an extra penalty to the composite z-score.
Result: 56 / 100, Attention Needed.
LeCoach's AI coaching message renders that as: "Your wellness metrics indicate poor recovery. Rest or very light activity is recommended. HRV is significantly below your normal range, and multiple wellness metrics are below normal simultaneously."
That's exactly right. Not because sleep was bad — it was great. Not because training load was high — it was optimal. But because two of the most sensitive autonomic signals in the body sent a sudden, synchronized alarm that morning. Garmin's six-factor model didn't see it. LeCoach's four-factor model did, because it was built to look for it.
Four real days, two very different stories
Here is where the case study really separates the two systems. The same athlete, the same data feed, four consecutive days from May 15 through May 18 — and a clear arc of something is off → still off → starting to improve → fully recovered. Both apps were running the entire time.
The numbers below are real, pulled directly from both apps' screens.
Day 1 — Friday May 15: the warning
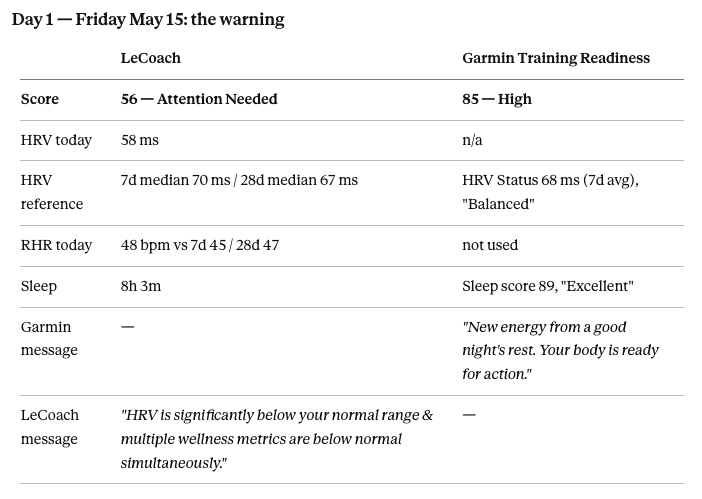
LeCoach detects the autonomic shock immediately and escalates to Attention Needed. Garmin reads the 7-day average, doesn't see RHR at all, gives the athlete a green light. First clear divergence.
Day 2 — Saturday May 16: Garmin doubles down
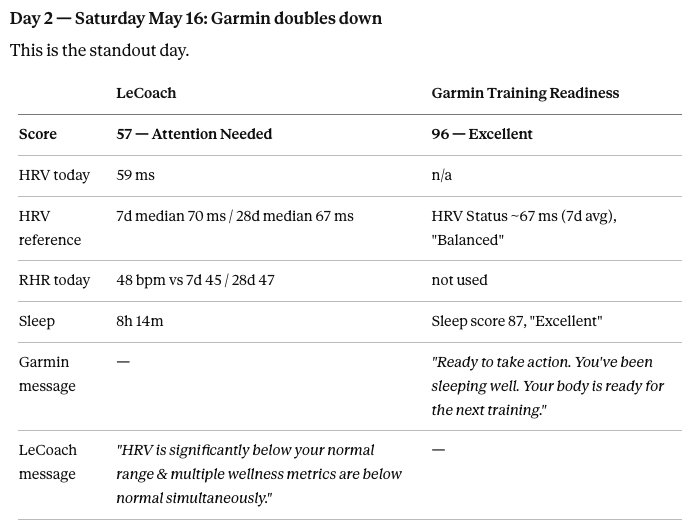
The athlete is still under stress — HRV is again deep below baseline, RHR is still elevated. LeCoach correctly holds the warning at 57.
And Garmin? Garmin goes up to 96 — "Excellent", telling the athlete "you've slept well, your body is ready for the next training." This is the single clearest illustration of the methodology gap. On the second day of a real autonomic dip, the smoothed 7-day average has not yet moved enough to bother Garmin's HRV Status, and a slightly better acute load reading nudges the composite score higher. Garmin doesn't just miss it — it actively recommends pushing harder.
For a serious cyclist, this is exactly the wrong message at exactly the wrong time. Hard training on the second day of a sub-clinical illness or accumulated autonomic stress is how a 3-day blip becomes a 10-day setback.
Day 3 — Sunday May 17: LeCoach catches the first improvement, Garmin finally starts dropping
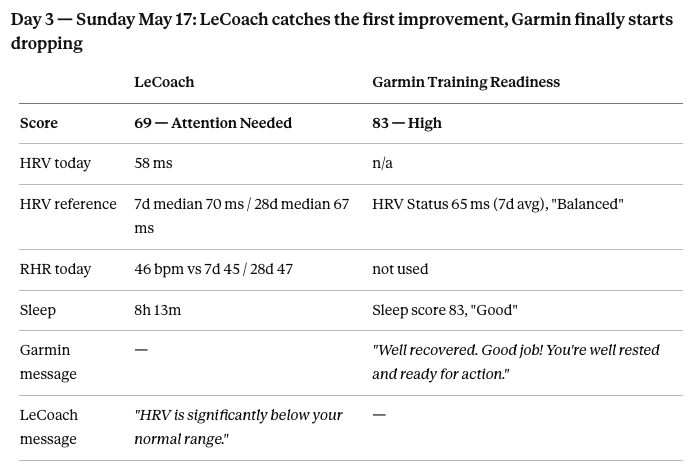
This is the first day things start to turn. LeCoach's Recovery Score moves from 57 → 69 — a meaningful upward step that correctly registers that something is improving. RHR has come back closer to baseline (46 vs the 7-day median of 45), so the multi-metric dip is no longer firing. But HRV is still 58 ms, well below both the 7-day (70 ms) and 28-day (67 ms) median, so the HRV crash override still triggers and LeCoach correctly keeps the readiness tier at Attention Needed. The system is telling the athlete exactly the right thing: getting better, but not quite there yet — don't push hard yet.
Garmin is finally starting to react. The Training Readiness score has dropped from 96 → 83, and the HRV Status 7-day average has now drifted from 68 → 67 → 65 ms. So Day 3 is where Garmin first acknowledges that something might be off — two full days after LeCoach raised the alarm, and exactly on the day LeCoach started reporting improvement. Both numbers are still in the "High / Balanced" green band, and the on-watch message is still telling the athlete they are well rested and ready for action.
Day 4 — Monday May 18: real recovery (only LeCoach knows)
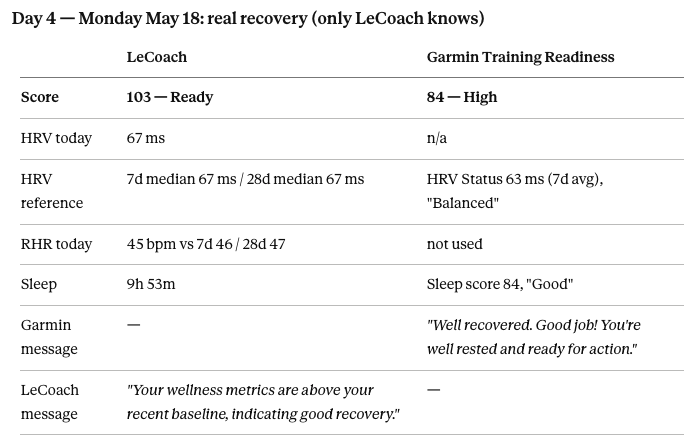
This is the recovery day. The athlete's HRV has snapped back to 67 ms — right on the 28-day baseline — and RHR is back to 45 bpm. Sleep was nearly 10 hours. LeCoach correctly reads this as 103 — Ready and tells the athlete their metrics are above baseline.
Garmin's HRV Status 7-day average is still 63 ms — actually lower than yesterday, because the depressed days from Friday/Saturday/Sunday are still inside the 7-day window. Garmin's score is 84, essentially unchanged from yesterday. Garmin missed the recovery the same way it missed the dip.
The arc, side by side
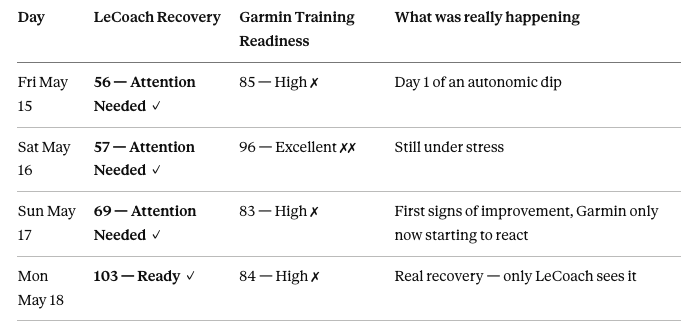
For four consecutive days, Garmin's Training Readiness stayed in the High–Excellent range and recommended training as planned. LeCoach correctly tracked the entire arc: warning, sustained warning, early improvement, full recovery.
This is not a hypothetical. The screenshots are real, the user is real, the dates are real. And the gap between the two readouts is exactly what the methodology differences predict.
The underlying philosophy: norms vs. baselines
Most commercial wellness devices — Garmin Training Readiness included, along with WHOOP's recovery, Oura's readiness, and Coros's recovery indicator — compare your data against one of two things:
Population norms — How you compare to other people.
Short-term rolling averages — How today compares to your recent week.
Both have blind spots.
Population norms are nearly useless for personal recovery assessment. Whether a 58 ms HRV is "good" depends entirely on whether you typically sit at 48 ms or 78 ms. These numbers are meaningless without personal context.
Short rolling averages are better — but they adapt too fast. A week of illness, overtraining, or disrupted sleep shifts the 7-day average itself, which then sets a new "normal" that is actually a new "depleted." The baseline chases the problem instead of detecting it. The four-day arc above is a textbook example of this: by the day the athlete actually recovered, Garmin's 7-day HRV average had drifted down enough that Garmin was reading the rebound day as just another day in a slightly lower band.
LeCoach's dual-baseline approach with both a short-term and a longer-term anchor is specifically designed to solve this:
If you've had a rough week and your short-term baseline is depressed but your long-term baseline is normal → the short-term drives the score (you're below recent baseline, flagged).
If you've had a great week but one bad day → the long-term provides the stable reference (you're below your true normal, flagged).
If you're in a genuine recovery rebound → both windows converge, and the score reflects good readiness.
The MAD-based robust z-score adds another layer of protection. Because it uses the median (not the mean) and measures spread via median absolute deviation (not standard deviation), extreme readings don't inflate the baseline or artificially compress the signal range.
What does the science actually support?
There is a popular reading of the HRV literature that says: "always look at the 7-day average, never the daily value." That reading is half right. Here's what the literature actually says, with citations:
Day-to-day HRV is noisy. 10–20% variation around a personal baseline is normal noise driven by sleep timing, alcohol, hydration, hormonal cycles, ambient temperature, and so on. A single low reading by itself is not diagnostic. (Buchheit 2014)
Sustained drops are very informative. A drop of 20–30% sustained for several days, especially > 5 days, strongly suggests a meaningful imbalance between stress and recovery. (Plews et al. 2013)
Personal baselines beat population norms. Tracking deviation from your own rolling baseline is more sensitive than comparing to population HRV norms. (Buchheit 2014)
HRV can flag pre-symptomatic illness. HRV dips often precede upper-respiratory illness symptoms by 12–24 hours in athletes. (Flatt & Esco 2016, J Sports Sci Med) For the practical side of this — how to come back when you have actually been ill — see our pillar on training after illness or time off.
Resting HR is a robust complementary marker. A 5+ bpm unexplained elevation in morning RHR is associated with under-recovery and impending illness in athletic populations. Research from the Norwegian School of Sport Sciences and Australian Institute of Sport has documented this for decades.
Wearable sleep stages are noisier than wearable sleep duration. Consumer wearables measure total sleep time well, but disagree substantially on sleep staging — which drives most "sleep score" outputs. Using duration alongside the score is more robust than weighting the score alone. (Sensors 2023)
So the science is consistent with two things at once:
Smoothing matters for trend identification.
Personal-baseline deviation matters for acute change detection.
The right architecture is to combine both, using the baselines as the reference and the deviation as the signal. Garmin Training Readiness scores the reference. LeCoach scores the deviation, using both short-term and longer-term references to keep the baseline honest.
What this means for how you train
The practical consequence is direct: if your recovery tool tells you "you're ready" when your body is actually under stress, you do more work than you should. That can mean:
A hard interval session when your immune system is already fighting something off.
Pushing through a threshold workout during fatigue that hasn't yet shown up as poor performance.
Missing the early signal that a training block needs to be adjusted down.
Conversely, if your tool keeps you in "low readiness" while you're recovering, you back off training you could have done — leaving fitness on the table.
For serious cyclists managing structured training — the kind of athlete LeCoach is built for — these aren't theoretical edge cases. They happen every block. The four-day case study above is exactly this scenario: sleep was excellent throughout, training load was optimal throughout, but two autonomic signals fired simultaneously and then recovered. That sequence, measured correctly, is the difference between a well-managed training week and a week of digging a hole. This is also exactly why an adaptive cycling training plan needs a recovery-score input that is sensitive enough to actually move the plan when something is off, and stable enough not to chase noise — both fatigue management and day-to-day plan adjustments depend on it.
FAQ: Garmin Training Readiness and recovery scoring
Is Garmin Training Readiness accurate?
It is reasonably accurate as a trend indicator over multi-day periods, and it is much better than relying on subjective feel alone. It is less accurate as an acute indicator for individual days, because its HRV input is averaged over 7 days, it does not include resting heart rate, and it counts sleep and training load twice each. The result is a score that lags real changes in your physiology by 1–2 days in both directions — exactly as the four-day case study above shows.
Does Garmin Training Readiness use resting heart rate?
No. Garmin Training Readiness combines sleep score, recovery time, HRV status, acute load, recent sleep history, and recent stress. Resting heart rate is tracked by your Garmin watch separately, but it is not a factor in the Training Readiness score.
Why is my Garmin Training Readiness high when I feel awful?
Three common reasons. (1) Your HRV crashed last night but the 7-day average still looks normal. (2) Your slightly elevated resting heart rate isn't being counted. (3) Your sleep score was decent and your training load is currently low, so several of the six factors are pushing the score up structurally. The case study in this article shows Garmin landing on 96 — "Excellent" — on day two of a clear autonomic dip, for exactly these reasons.
Why is my Garmin Training Readiness low when I feel great?
Often the inverse of the above. After a few hard or low-HRV days, the 7-day HRV average sits at the bottom of your baseline range. When you bounce back, today's good reading looks like an outlier above a depressed average — and Garmin can flag this as "HRV unbalanced — high," driving the score down for a day or two even though you're actually recovered.
Should I use Garmin Training Readiness or LeCoach Recovery Score?
If your goal is general fitness tracking with a watch you already wear, Garmin Training Readiness is a perfectly good tool. If your goal is structured training — periodised plans, intervals, peaking for events — the methodological differences become much more consequential, and LeCoach's Recovery Score is designed for that use case. LeCoach uses the same overnight HRV, RHR, and sleep data your Garmin already records (synced via Intervals.icu), so you can run both side by side and see how they behave on your own physiology.
What about WHOOP and Oura?
WHOOP and Oura both include resting heart rate (and respiratory rate, in WHOOP's case), which gives them a structural advantage over Garmin on the autonomic side. Both still use relatively short baselines and proprietary scoring. The case study in this post would likely produce a low recovery score on WHOOP, a closer call on Oura, and "High readiness" on Garmin — which is roughly what user reports across the three platforms suggest.
LeCoach is an AI cycling coach that calculates your Recovery Score automatically each morning from your Intervals.icu wellness data — HRV, resting HR, sleep duration, and sleep score — calibrated against your personal short-term and longer-term baselines. No setup required if you're already synced with Intervals.icu. Garmin users get their data into LeCoach via the standard Garmin → Intervals.icu sync.
Try LeCoach free at lecoach.app.
Related reads on LeCoach
HRV for cyclists — the pillar guide to what HRV is, what changes mean, and how it fits into structured training.
HRV vs resting heart rate for cyclists — when each marker matters more.
What to do when HRV drops — practical playbook for the morning your number suddenly looks bad.
Cycling recovery and fatigue — the cornerstone hub for everything recovery-related.
Sleep and recovery for cyclists — how sleep duration and quality interact with training adaptation.
References and further reading
Peer-reviewed
Plews, D.J., Laursen, P.B., Stanley, J., Buchheit, M., & Kilding, A.E. (2013). Training adaptation and heart rate variability in elite endurance athletes: opening the door to effective monitoring. Sports Medicine, 43(9), 773–781. Link
Buchheit, M. (2014). Monitoring training status with HR measures: do all roads lead to Rome? Frontiers in Physiology, 5, 73. Link
Flatt, A.A., & Esco, M.R. (2016). Smartphone-derived heart rate variability and training load in a women's college soccer team. Journal of Sports Science & Medicine, 15(1), 26–33. Link
Chinoy, E.D., et al. (2024). Evaluating accuracy in five commercial sleep-tracking devices compared to research-grade actigraphy and polysomnography. Sensors. Link
Garmin / industry documentation