Most riders finish a session buried in numbers. Power, heart rate, time in zone, HRV, sleep, CTL, ATL, TSB, efficiency factor, decoupling. It's all sitting there somewhere, usually spread across two or three apps, and stitching it together takes long enough that you give up before you reach the only question that counts: what does today actually tell me, and what should I do tomorrow?
This is a walkthrough of how to read all of it the way a coach would, starting with this morning's recovery and finishing with what the ride did to your fitness. We'll use the rebuilt LeCoach day view, because it's at least according to us, it’s the best overview of recovery, workouts, habit tracking, weight tracking and training in a single daily overview.
What's new: We rebuilt the day view from scratch. The LeCoach day view is a full coaching dashboard, where you see everything you need to see about your recovery, your habits, your wellness, your scheduled workouts and activities on a single intuitive page. Treat this post as a tour.
Recovery: HRV, resting heart rate and sleep
A good coach doesn't open with "how was the ride." The first question is what shape you were in before you clipped in. Recovery sets the context for everything that follows. The same workout can be a quiet win on a tired day or a wasted opportunity on a fresh one, and you can't tell which until you know where you stood that morning.
LeCoach builds its recovery read from four signals, and it weighs each one against your own normal instead of a population average. HRV is the headline. It tracks your autonomic nervous system and tends to dip before fatigue or illness shows up anywhere else. Resting heart rate is the old reliable: an unexplained morning bump usually means you're under-recovered before your power admits it. Sleep duration is a strong predictor of how much you'll absorb the next day, and your wearable's sleep score rounds things out as a softer, secondary signal. Our HRV for cyclists page has the detail if you want it.
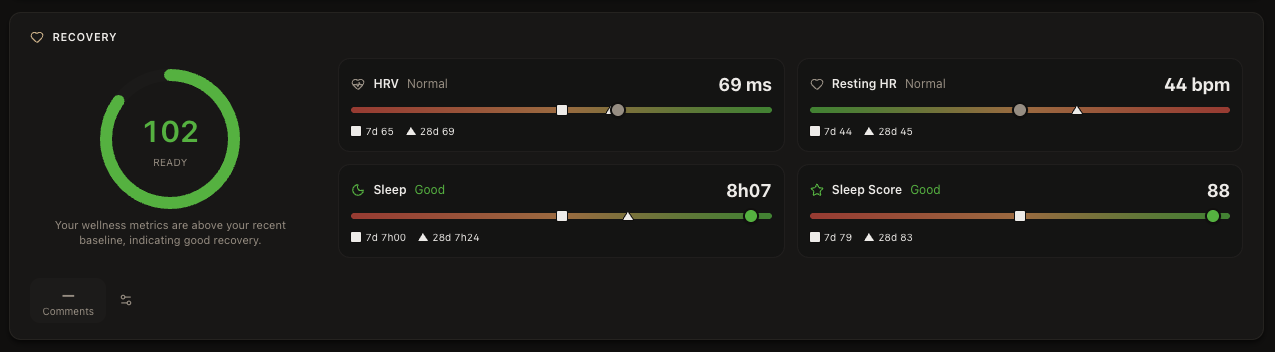
The score itself reads 100 when you're sitting on your baseline. Above 100 you're fresher than usual, below it something is off. What changed in the rebuild is the context around each metric. You now see today's value next to its 7-day and 28-day numbers, so a single odd morning is easy to tell apart from a genuine downward drift.
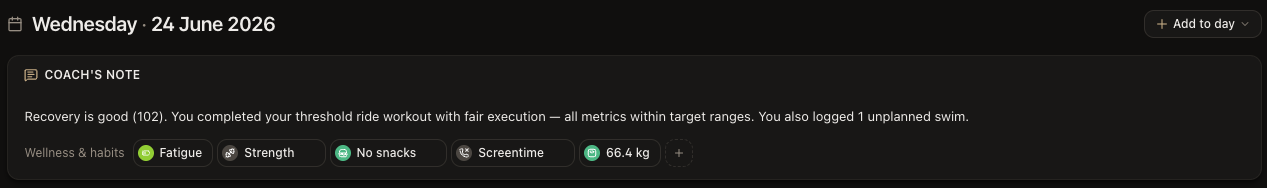
Take the day in the screenshot. Recovery reads 102, Ready. HRV is 69 ms and resting HR is 44 bpm, both right on the 28-day baseline, and sleep came in at 8h07 with a score of 88. Nothing is flagging. That's a green light to run the planned session as written.
If you want the full method behind the number, including why anchoring to your own baseline beats a generic wearable score, the LeCoach Recovery Score explained and our recovery and fatigue guide go deeper.
Habits, weight and daily notes
Recovery numbers tell you how the night went. The habit chips tell you whether you're doing the small things that make the training stick. Habits in LeCoach are just custom tasks you decide to track: a daily stretch or mobility session, taking your supplements, strength work, staying off the snacks, whatever you're trying to hold yourself to. You set one up once, then tap the chip to mark it done and tap again to clear it. Some you run every day, some a couple of times a week.
They sit in the same row as your wellness, so the behaviour and the result are right next to each other. And because they're tasks rather than training, they don't get counted into your load or your zone time. They're there to keep you honest, not to pad your numbers.
Weight lives in that row too. Log it day to day and it tracks alongside everything else, so a drift up or down is visible in context instead of buried in a separate app. If you already record weight through Intervals or a connected scale, it shows up here on its own.
Then there's the note. On any day you can write a line or two about how it actually went: legs felt flat, stomach off, slept badly in a hotel, great day out. It's the context the numbers can't capture, and your AI coach reads it, so "felt rough, cut it short" becomes something the plan can respond to rather than an unexplained dip in the data.
Holidays, sick days and injuries
Real life doesn't care about your training plan. You travel, you catch a cold, you tweak a knee. From the day header you can mark a day as a holiday, a sick day or an injury, and that does two useful things. It tells the plan you're not available, so a missed session reads as a rest day rather than a hole in your week. And it gives your AI coach the reason, so instead of shoving the same block of intervals into a week you spent ill, it adapts around what actually happened.
It takes one tap, but it's the difference between a plan that nags you for workouts you were never going to do and one that adjusts to the week you actually had.
Power, heart rate and your route
Once you've got the context, open the activity. Two questions matter: how hard was it really, and how did your body take it?
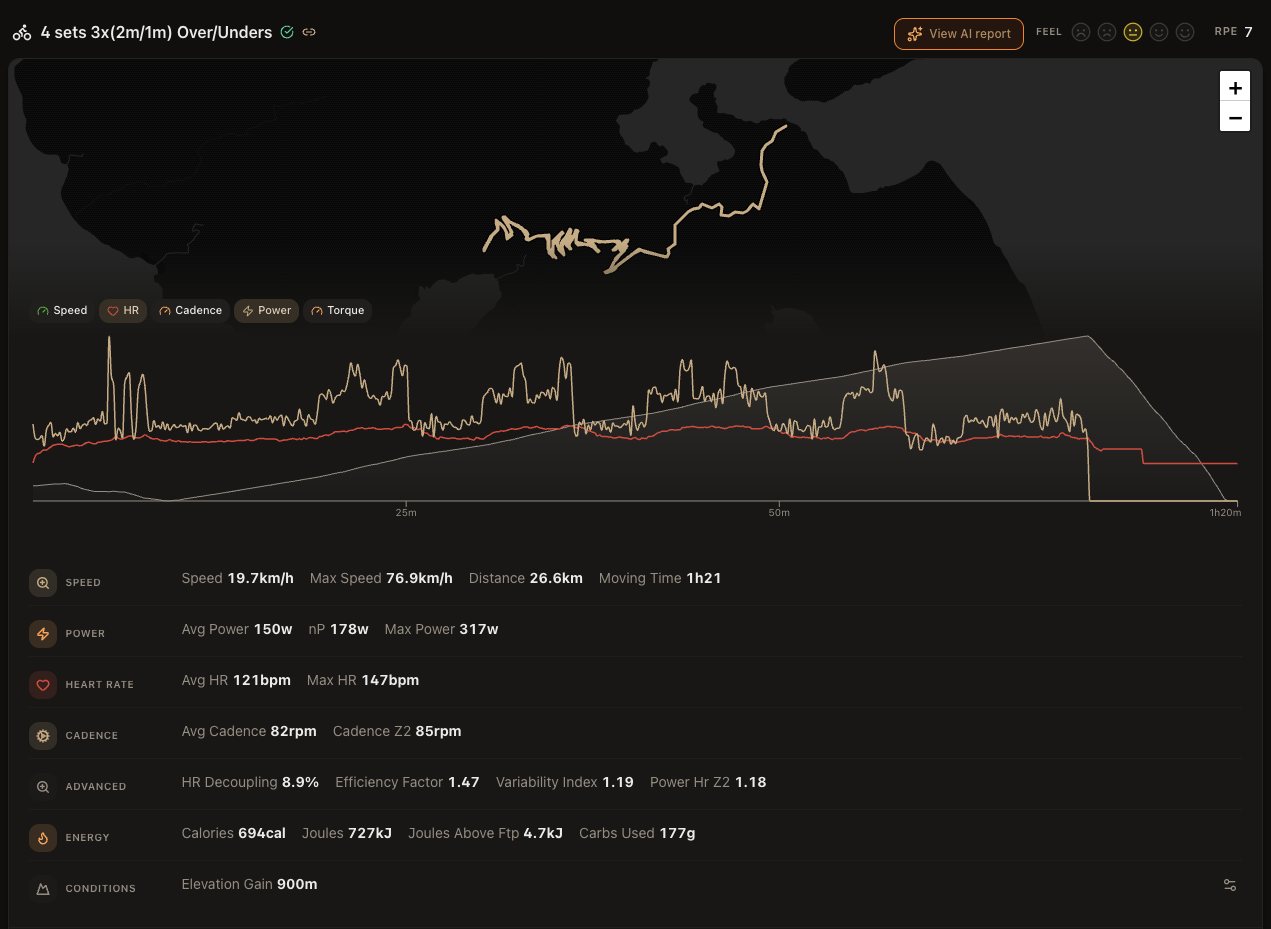
Power and heart rate answer different halves of that. Power is the work you put out, and it reacts the instant you push harder. Heart rate is the cost your body paid, and it's slower and a bit unreliable, nudged around by heat, caffeine, how hydrated you are and how tired you already were. You learn the most by reading the two side by side, which is why the day view plots speed, heart rate, cadence, power and torque in one graph you can flick between, sitting right next to your route map.
A few numbers are worth knowing how to read. Normalised power against average power tells you how even the ride was. In the example, 150 W average versus 178 W normalised says it was punchy and full of surges rather than steady. Efficiency factor, which is normalised power divided by average heart rate, is one to watch across weeks rather than within a single ride: if it climbs at the same heart rate, your aerobic engine is getting stronger. HR decoupling measures how far your heart rate drifted up relative to power in the back half. Under roughly 5% is tidy, and the 8.9% here is normal once you've got hard intervals in the mix.
You don't need to hold all of this in your head. Your AI cycling coach reads the same numbers and will tell you what they mean in plain language. Knowing what each one is for just makes those conversations quicker.
Workout execution and interval breakdown
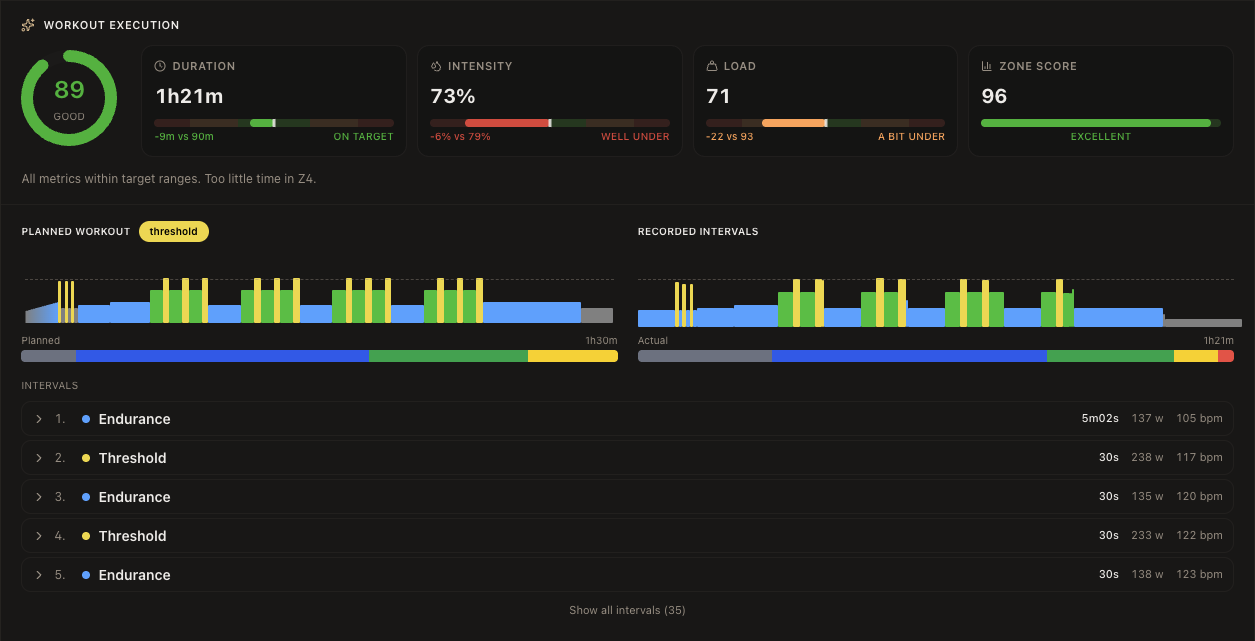
Raw numbers won't tell you whether you did the session you were meant to. That's the job of the execution view. It scores every completed workout against its plan on four counts, each with its own gauge. Duration is whether you rode as long as prescribed. Intensity is whether the average effort landed where it should. Load is whether you banked the planned stress. Zone score is whether your time-in-zone matched the point of the session.
Underneath the gauges, it lays out every planned interval against what you actually recorded, rep by rep and colour-coded by zone. A threshold set that quietly slid into tempo has nowhere to hide.
The over/unders workout in the example scored 89, a Good. Duration was on target and the zone score was excellent at 96. Intensity, though, came in well under, 73% against a 79% target, with barely any time in Z4. That's a specific, usable read. The rider held the right structure but didn't dig deep enough on the hard efforts, and the obvious fix is to lean harder into the "over" segments next time. That loop of plan, measure, adjust is what we mean by structured, adaptive training.
Heart-rate zones
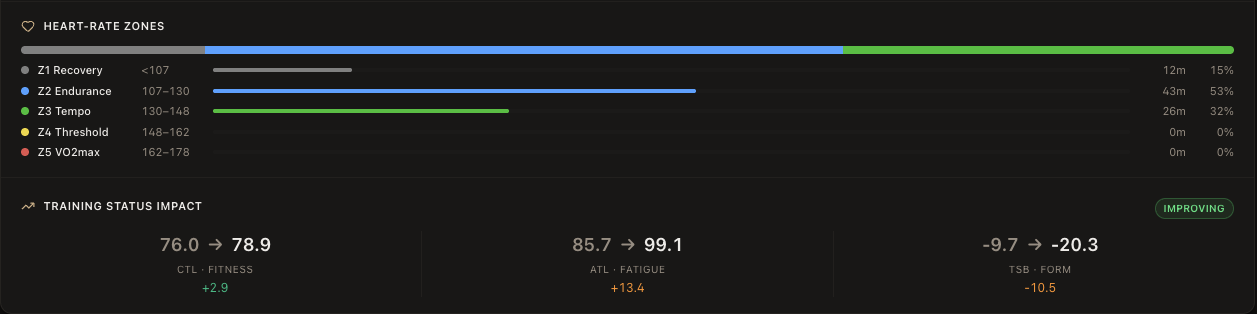
An average intensity number hides as much as it shows. The heart-rate zone breakdown lays out where your time really went across Z1 to Z5, so you see the shape of the session rather than just its midpoint.
In the example: 15% in Z1, 53% in Z2, 32% in Z3, and nothing in Z4. For an over/unders set that's supposed to live around threshold, that empty Z4 is the whole story. The effort sat a zone too low. Over a longer stretch, zone distribution is also how you catch yourself drifting, like piling up Z3 when the plan asked for easy days easy and hard days hard. It's one of the most common ways people quietly stall.
Our cycling training zones guide covers how to set and use both heart-rate and power zones if you need a refresher.
Training load: CTL, ATL and TSB
Last, pull back and look at the trend, because one ride only means something in context. Three numbers track it. CTL, chronic training load, is a 42-day average of your training stress, and it stands in for fitness. ATL, acute training load, is the 7-day version, and it stands in for fatigue. TSB is simply CTL minus ATL, and it's your form: positive and you're fresh, negative and you're carrying load.
The new part is that the day view now shows what each individual activity did to those numbers, not only where you stand today. In the example, the ride pushed CTL from 76.0 to 78.9, so fitness ticked up a touch. ATL jumped from 85.7 to 99.1, a real fatigue hit. And TSB dropped from -9.7 to -20.3, well into loaded territory. None of that is good or bad by itself. In a build block a deeply negative TSB is the plan working. The week of a race, it's a warning.
Where it gets useful is what those numbers drive next, which is the entire job of an adaptive training plan. Scheduled workouts now also show your projected form for the day they fall on, so you can see what shape you'll be in when a key session arrives instead of guessing from where you are today.
The full day in one view
Read top to bottom, the day tells a simple story. You were well recovered at 102. You did the right workout but went a little easy on the hard efforts. And you took a genuine fatigue hit that dropped your form into the red. The call more or less makes itself: recovery is fine, so you don't need to back off, you need to commit to those "over" efforts next time.
That's what the rebuild is for. The goal wasn't to add more numbers. It was to put the ones you already have, plus the habits and life events that shape them, in the order a coach reads them. At the top of the page, your AI coach sums the day up in a line or two, so you get the gist before you dig into any of it.
FAQ
What's a good TSB for cycling? It depends what you're chasing. In a build block, a negative TSB in the -10 to -20 range is normal and intended, because you're loading on purpose. Going into an event you usually want it positive, somewhere around +10 to +25, so you turn up fresh. The number isn't good or bad on its own. It only means something next to your goal for that week.
What does HRV actually tell a cyclist? It reflects the state of your autonomic nervous system, which makes it the most informative single number you get each morning for fatigue and readiness. A dip below your own baseline often shows up before your power does. That's why LeCoach leans on it and always reads it against your personal normal rather than a population average.
What's the difference between CTL and ATL? Both average your daily training stress, just over different windows. CTL uses 42 days and stands for long-term fitness. ATL uses 7 days and stands for short-term fatigue. Subtract ATL from CTL and you've got TSB, your form.
Can I track habits and weight as well as workouts? Yes. Habits are custom tasks you set yourself, like stretching, supplements or staying off the snacks, and you tap them done each day. Weight sits in the same wellness row and tracks day to day. Neither counts toward your training load, so they give you context without skewing your numbers.
What happens if I'm sick, injured or away? Mark the day as sick, injured or a holiday from the day header. LeCoach treats it as time you're unavailable rather than a missed session, and it passes the reason to your AI coach so your plan adapts around it instead of nagging you for the workout.
How do I know if I actually did a workout right? Check it against the plan on duration, intensity, load and time-in-zone. The day view does this for you with execution gauges and a planned-versus-recorded interval list, so you can see at a glance whether a threshold session really hit threshold.
Where does LeCoach get all this data? From your existing Intervals account, which pulls activities and wellness from Garmin, Wahoo, Zwift, Whoop, Oura and the rest. LeCoach reads it, scores it and turns it into coaching. No new device, no extra logging.
Want to see your own day laid out like this? Start free with LeCoach.